
You can view the real-time status of MyQ Roger components here https://status.myq.cloud/ .
Check live and historical data related to MyQ Roger system’s performance and see if there is a planned or unplanned outage or scheduled maintenance. From the main status page, you can:
-
View the current status.
-
Review past incidents.
-
Subscribe to updates.
The Service Status link on any page returns you to the main status page.
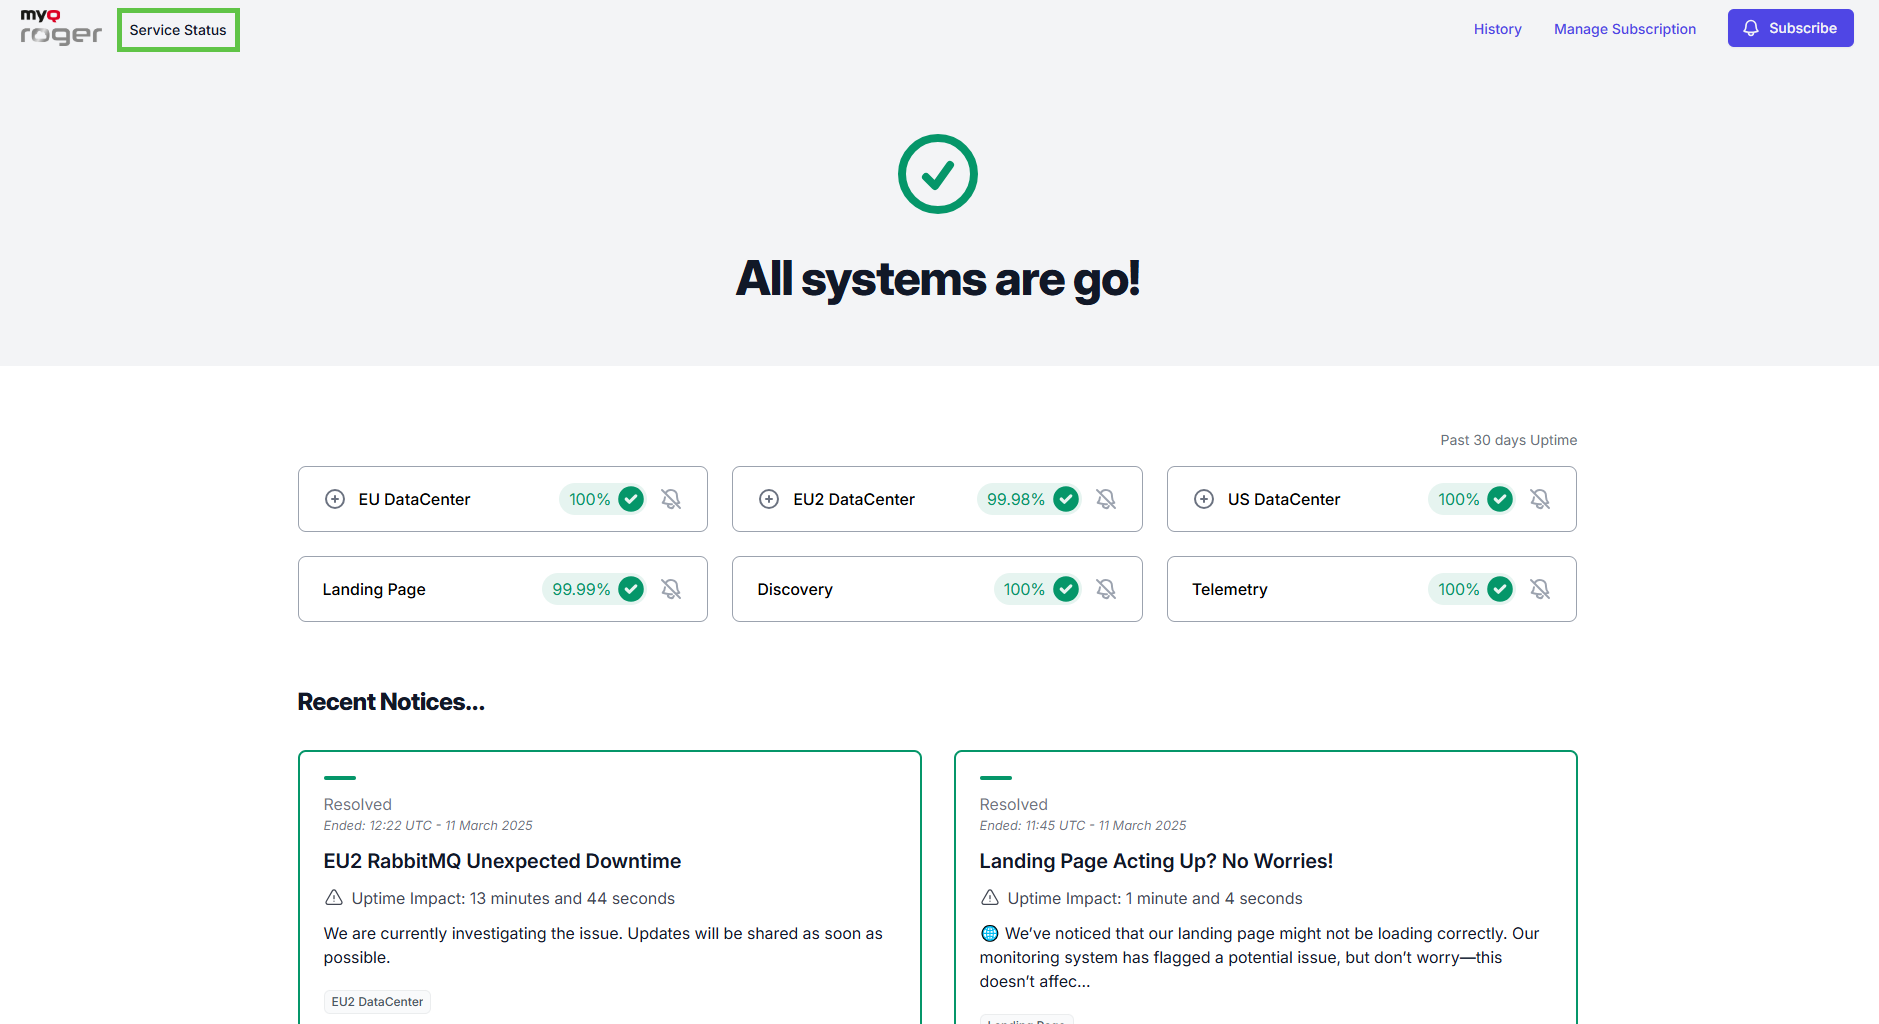
Current Status
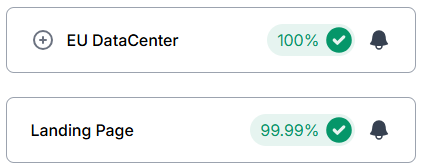
There is information about each datacenter (EU, EU2, US) and its components at the top of the page. You can select your corresponding datacenter and click the plus (+) icon next to its name to expand it and view each component. If there is downtime, it will be marked.
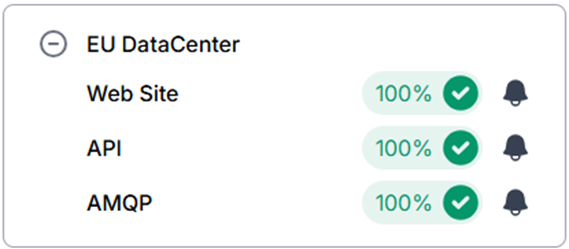
Expanding DataCenter Details
-
To expand any Datacenter’s details, click on the + (plus) icon next to the DataCenter or click on the Percent value. Each DataCenter displays the status of its Web Site, API and AMQP services.
-
To collapse this list, click on the - (minus) icon next to the DataCenter.
Viewing DataCenter Details
To expand the details for any DataCenter:
-
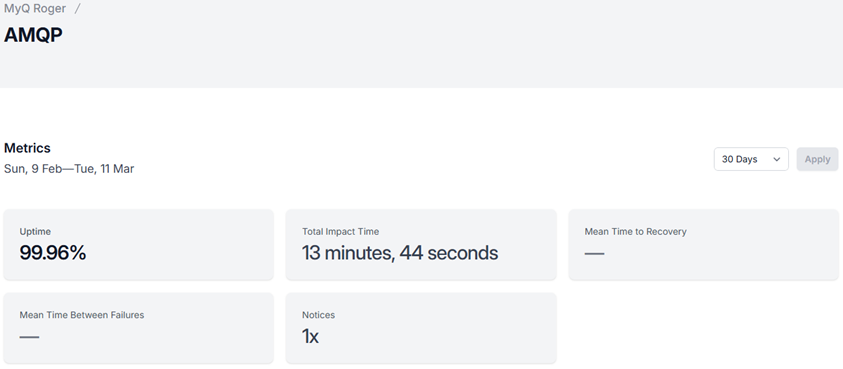
Click on any Percent value for either Web Site, API or AMQP to go to a MyQ Roger page for that entry, which displays the Metrics for that service (30 days by default).
-
Click on the time value and select of the following:
-
7 Days
-
30 Days
-
3 Months
-
6 Months
-
1 Year
-
Custom
To specify a different time value, click Custom.
-
-
Once a time range has been specified, click Apply to filter the metrics for that DataCenter.
Viewing Additional Metrics
Click on any Percent value for either Landing Page, Discovery or Telemetry takes you to the MyQ Roger page for that entry, displaying the Metrics for the time range (by default 30 days).
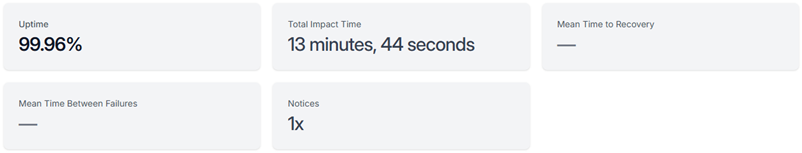
The metrics for Landing Page, Discovery or Telemetry include:
-
Uptime: By percentage
-
Total Impact Time: In minutes and seconds.
-
Mean Time to Recovery: In minutes and seconds.
-
Mean Time Between Failures: In days and hours.
-
Notices: This value indicates how many incidents have occurred in this period.
Recent Notices
On the main status page, beneath the component statuses, there are panels with summaries of recent incidents. Clicking inside any incident panel displays additional details about that incident.
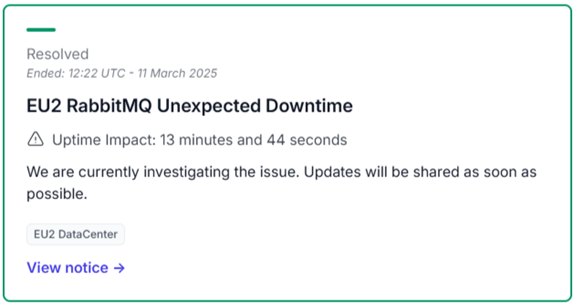
The details include:
-
The incident status (for example, Resolved/Unresolved).
-
The time and date of the status update.
-
The incident name (for example, EU2 RabbitMQ Unexpected Downtime).
-
The Uptime Impact duration in hours, minutes and seconds.
-
A brief description of the issue.
-
The affected component/s (for example, EU2 DataCenter).
-
A link to view all available details of this incident.
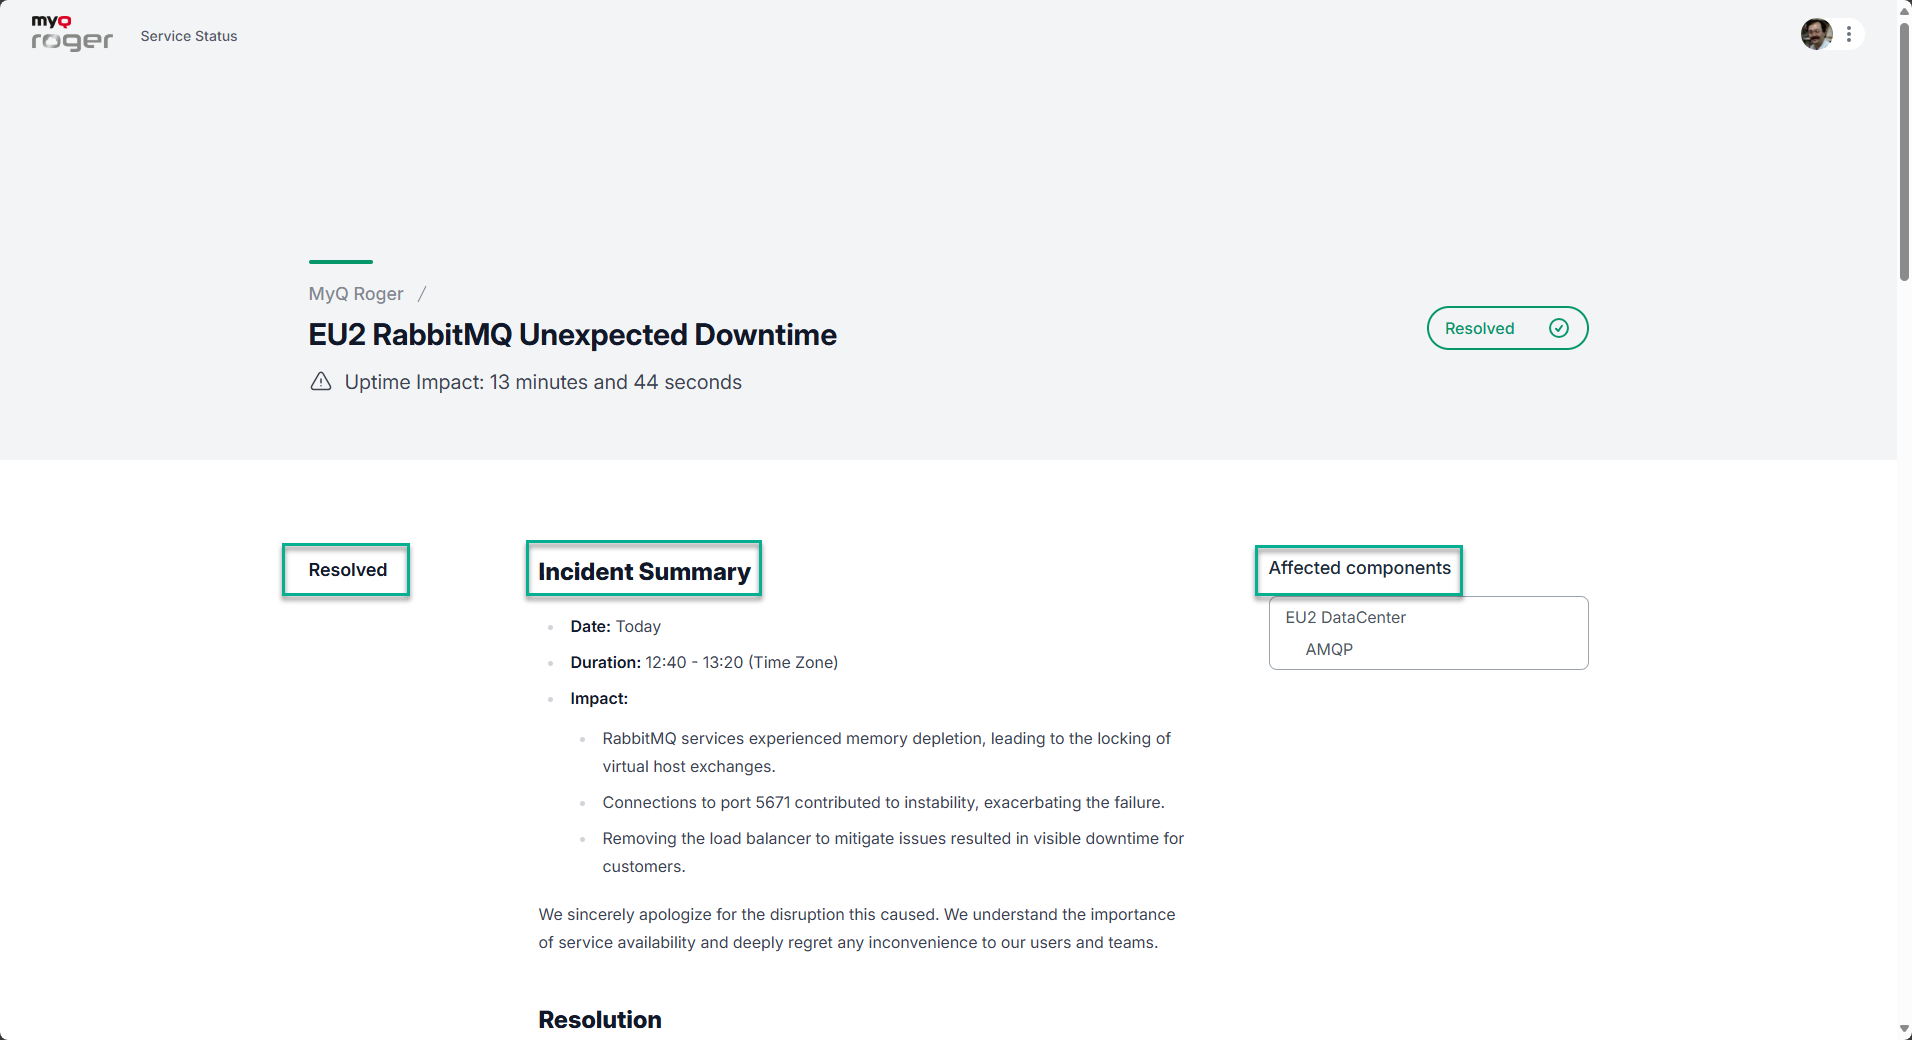
Recent Incident Details
To view details, click View notice to see the incident summary. The Incident Summary page includes:
-
Resolution status (for example, Resolved).
-
Incident Summary
-
Date of the incident.
-
Duration in hours and minutes (with specified Time Zone)
-
Impact: A description of the incident.
-
-
Affected components
-
The name of the DataCenter and its component(s) (for example: Web site/API/AMPQ).
-
Additional incident information follows:
-
Resolution
-
Root Cause Analysis
-
Corrective & Preventive Measures
Previous Notices
At the bottom of the main status page is the Previous Notices section, which shows the time and date of the last incident, as well as a link to go to the History page for all previous incidents.
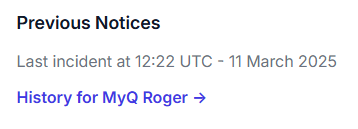
Click the History for MyQ Roger link to see the older incidents.
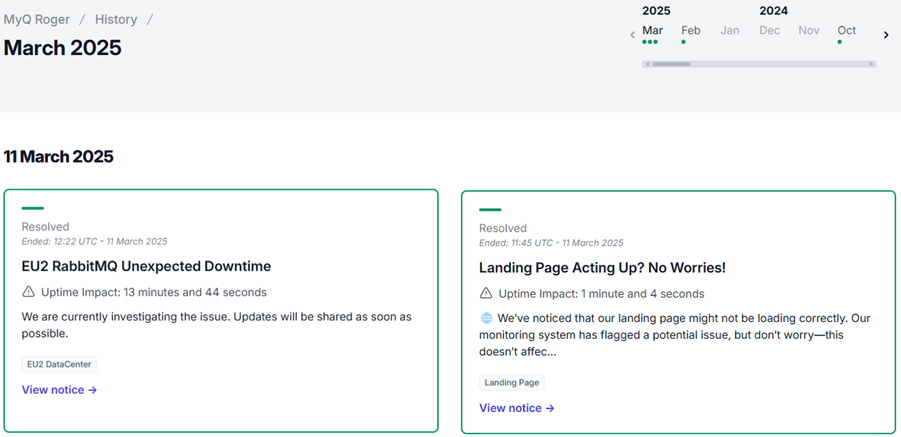
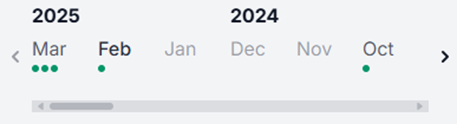
Appearing at the top right of the History page is a calendar. Here, you change the month being viewed (the green dots indicate incidents for that month, greyed out months do not have any incidents), You can use either the arrow buttons (< or >) or use the scroll bar to move the range.
Subscribe to Updates
To receive service status notifications:
-
Click the Subscribe in the top right corner, enter your Email address, and click Start subscription. You are informed that a secure link has been emailed to you.
-
Open the email and click on the Sign in to MyQ Roger button, which opens a new tab with the main service status page displaying your user icon at the top.
-
Clicking Already subscribed? takes you to the Find Your Subscription panel.
-
To manage an existing subscription, click the Manage Subscription link at the top right to display the Find Your Subscription panel. Enter your Email address and click Find Subscription. The Check Your Inbox panel displays informing you that a secure link has been emailed to you to manage your preferences.
Subscription Preferences
After you are subscribed, there is a menu beside your user icon, which displays Preferences and a Sign out option.
-
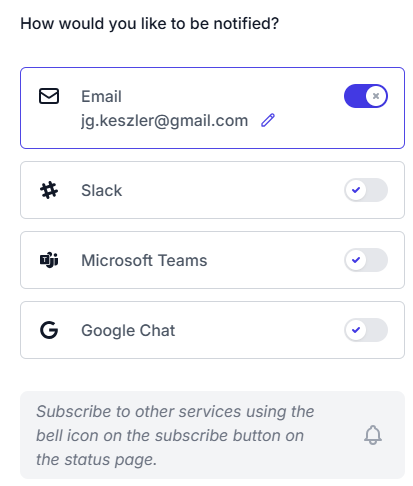
Click Preferences to choose via which channels you would like to receive notifications. The following services are available: Slack, Microsoft Teams, or Google Chat.
-
Enable any or all of the following services for your notifications. Complete the necessary details for whichever services you require. Click Done when finished.
-
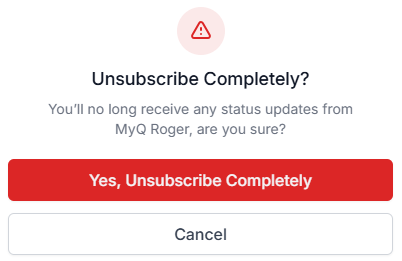
If you no longer require notifications, click Unsubscribe completely and then confirm in the dialog box that appears.
Subscribe to Select Components
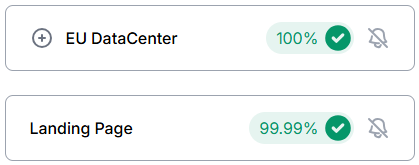
Before subscribing or at any point after subscription you can choose which components to receive notifications about.
-
From the main status page, click the bell icon beside any service, to turn notifications on or off.
-
After selecting the desired components, click Save Changes.