
In the Reports page, in Supervision > Reports, the MyQ Roger administrator (or a user with the Administration/Jobs/Reports permissions) has a full overview of all the users' jobs, as well as accounting information about each job in the Jobs tab, and can export jobs' reports in the Reports tab.
Jobs Tab
-
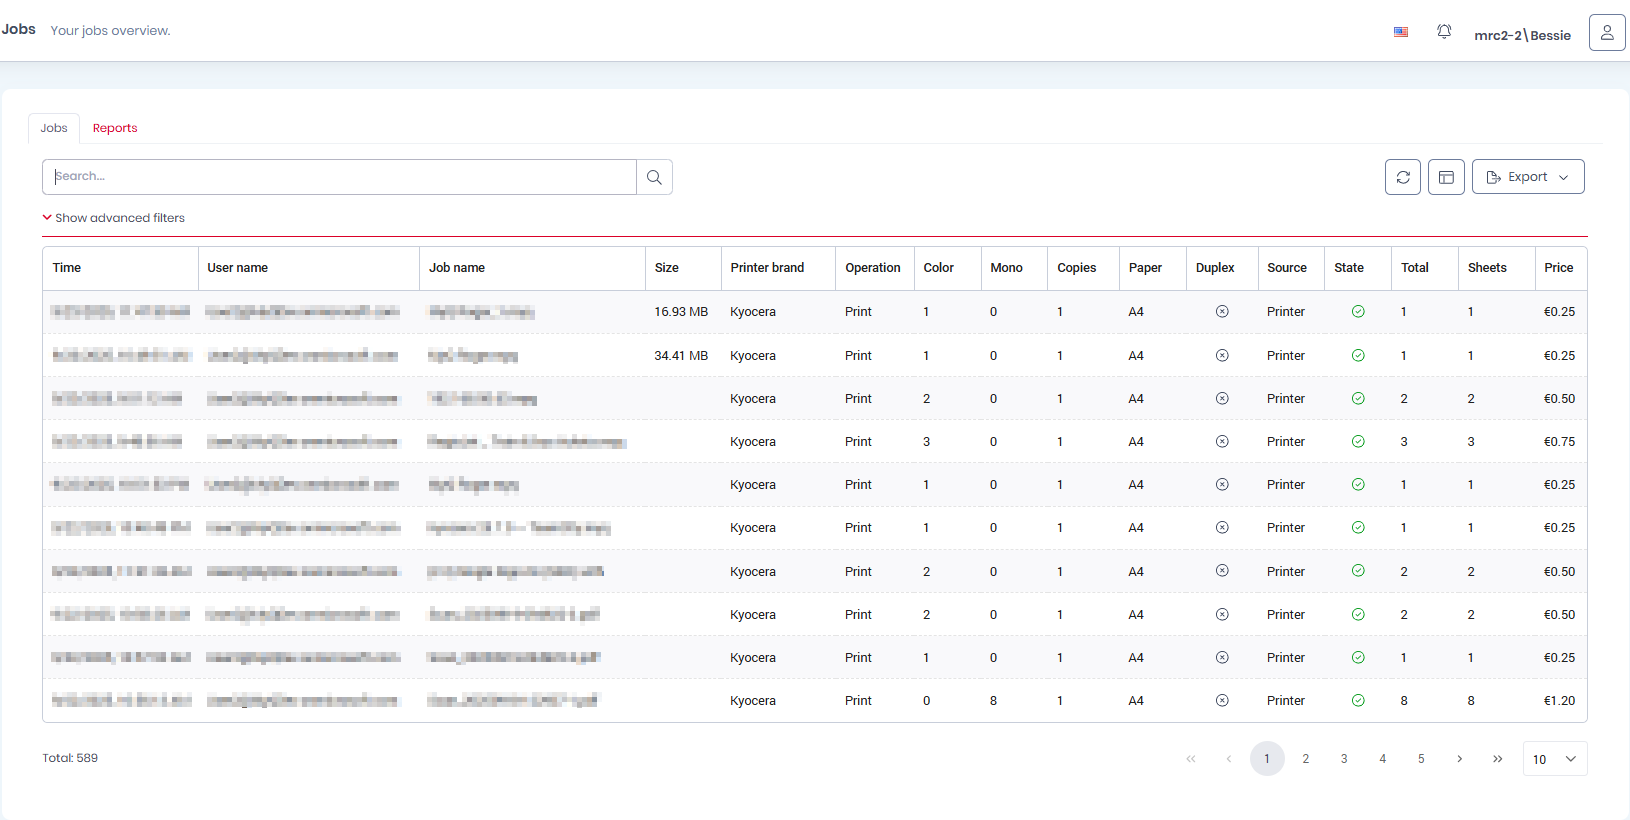
In the Jobs overview tab, there is a full overview of all the users' jobs, as well as accounting information about each job. Users without the necessary permissions can only view their own jobs.
-
To view details about a specific job, click on the job. The Job details panel opens.
-
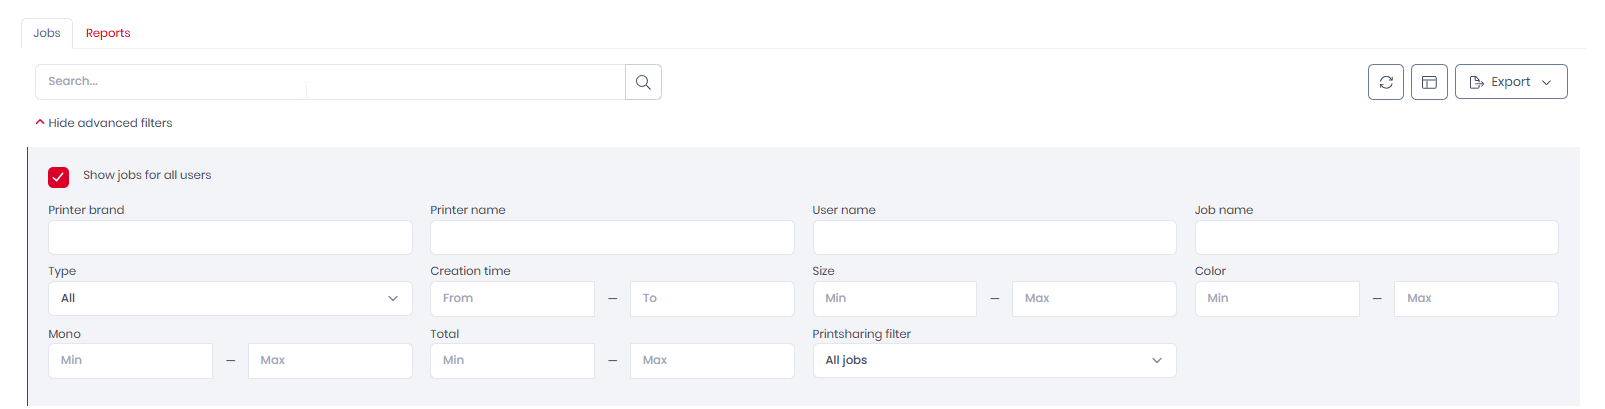
Under Show advanced filters there are many filters that can be used to modify what jobs are displayed in the overview.
-
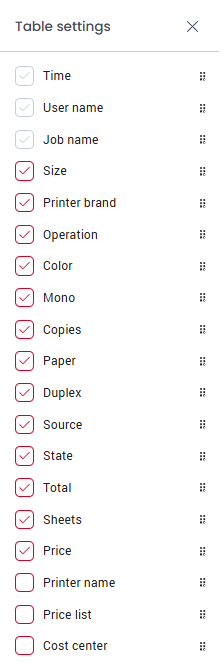
On the upper-right side, you can use the Column selection button to rearrange the columns shown in the overview.
-
Drag-and-drop columns from one side to the other or select a column and use the arrows in the middle and then click Save. All the columns in the Shown columns side will be displayed in the jobs overview.
-
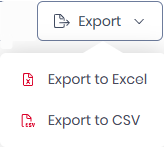
You can also use the Export button to export the overview to Excel or CSV:
Reports Tab
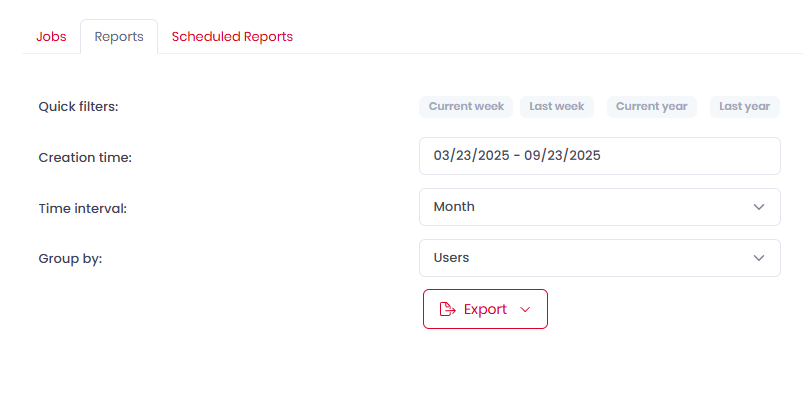
In the Reports tab, the MyQ Roger administrator (or a user with the Administration/Jobs/Reports permissions) can export jobs' reports.
-
Choose one of the available Quick filters: Current week, Last week, Current year, Last year.
-
Manually set the Creation time range.
-
Select the Group by time interval: Day, Week, Month, Year.
(This option is automatically set if you use a quick filter). -
Select how to group your report in the export in Group by: Users, Printers, Cost Centers, User groups, User groups, User groups and Cost Center, Printer Groups, Printer Groups and Cost Center (only available with a specific license).
-
Use the Export button to export your report to: Excel or CSV.
Scheduled Reports Tab
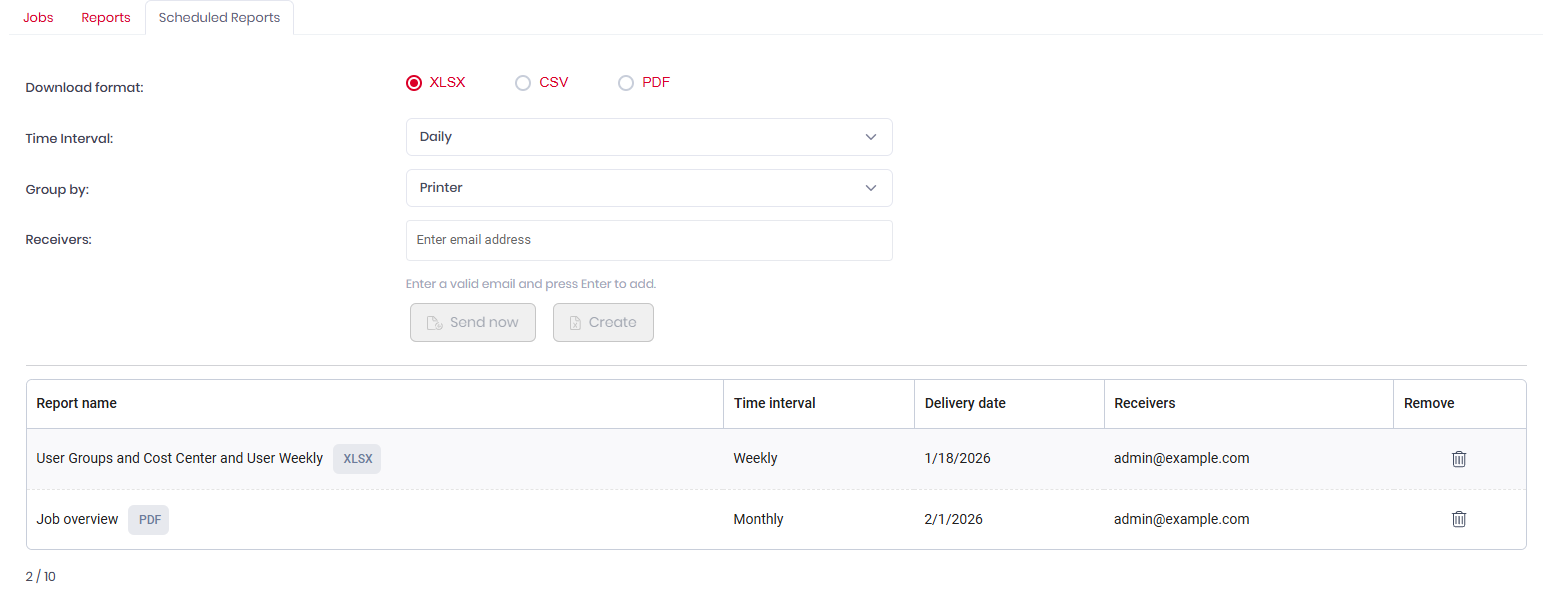
You can use the Scheduled Reports tab in Roger to create recurring automatically run reports. Scheduled reports are delivered to the email addresses of specified users.
Create a Schedule Report
To create a scheduled report:
-
Specify the Download format (XLSX, CSV or PDF).
-
Set the Time interval, this is how frequently the report will be generated (and the time period it is based upon) and sent.
-
(XSLX and CSV only) Select how to group your report in the export in Group by: Users, Printers, Cost Centers, User groups, User groups, User groups and Cost Center, Printer Groups, Printer Groups and Cost Center (only available with a specific license).
-
(PDF only) Select the report type from the available options:
-
General overview
-
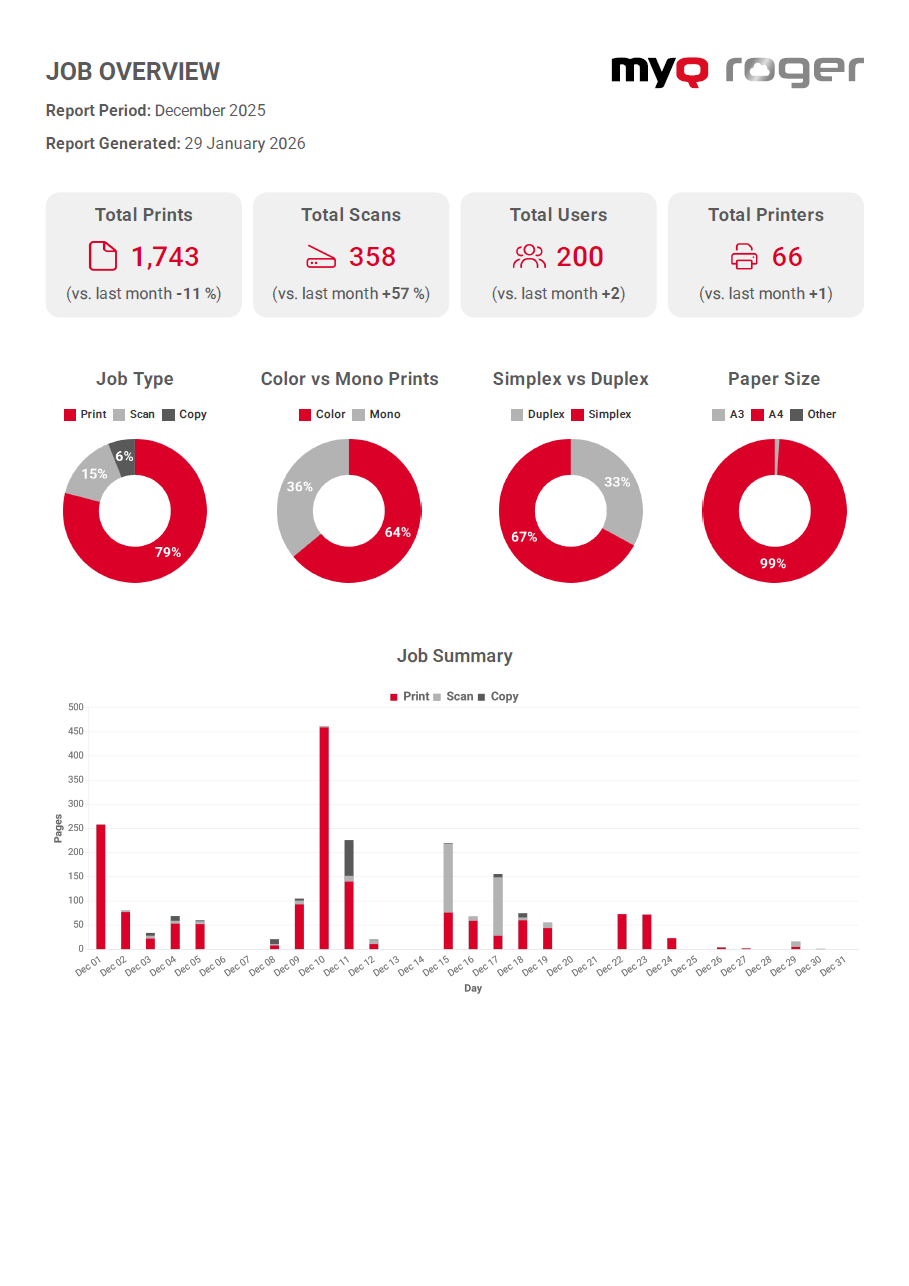
Job overview
-
Top 10 users
-
Top 10 printers
-
-
Enter the email address or addresses of one or more users who will receive the scheduled report.
-
Click Create to create and schedule the report, or Send now to generate and send the first version of the report immediately.
Delete a Scheduled Report
To delete a scheduled report, simply locate it in the table on the Scheduled reports tab, and press the delete icon in the Remove column. Scheduled reports cannot be edited, to change a report, delete and recreate it with the desired settings.
A maximum of 10 scheduled reports can exist at the same time.
PDF Reports In Detail
This section explains the data in your PDF reports, helping you monitor printing activity and identify trends across your organization.
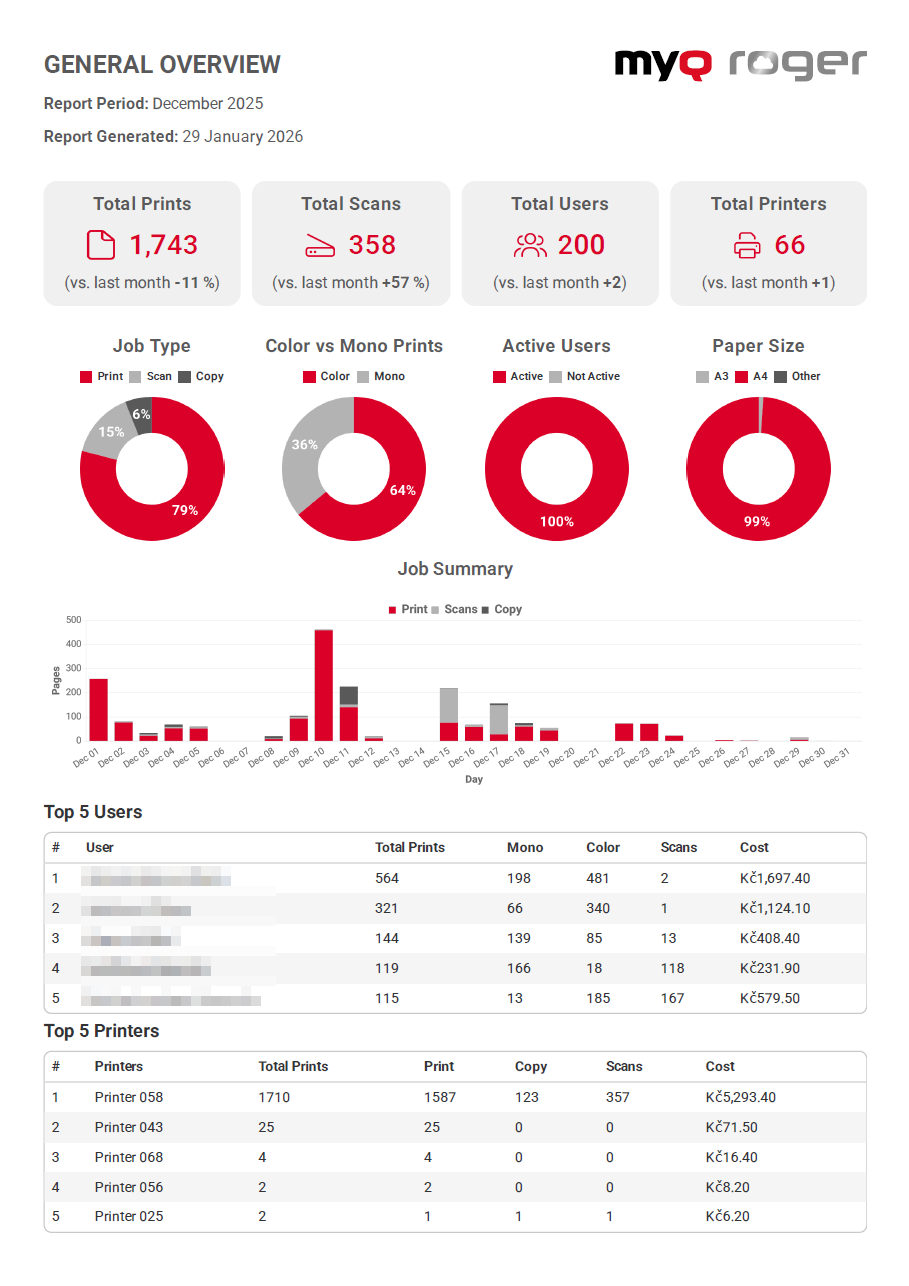
General Overview
The General Overview provides a high-level snapshot of your print environment.
|
Metric |
What It Shows |
|---|---|
|
Total Prints |
Total print sheets for the period, with percentage change from the previous period |
|
Total Scans |
Total scan sheets for the period, with percentage change from the previous period |
|
Total Users |
Non-deleted users created before the period end, with net change (created vs. deleted) |
|
Total Printers |
Non-deleted printers created before the period end, with net change (created vs. deleted) |
|
Job Type |
Breakdown of unique jobs by job type (for example, print, copy, scan). |
|
Color vs Mono |
Comparison of color vs. monochrome sheets (prints and copies only) |
|
Printed vs Deleted |
Ratio of jobs that were printed vs. jobs that were deleted before printing (unprinted deleted jobs). |
|
Active Users |
Breakdown of users based on their active/inactive status. |
|
Jobs Summary |
Daily breakdown of sheets processed for print, copy, and scan jobs |
Note: User and printer counts include all non-deleted records, regardless of active/inactive status.
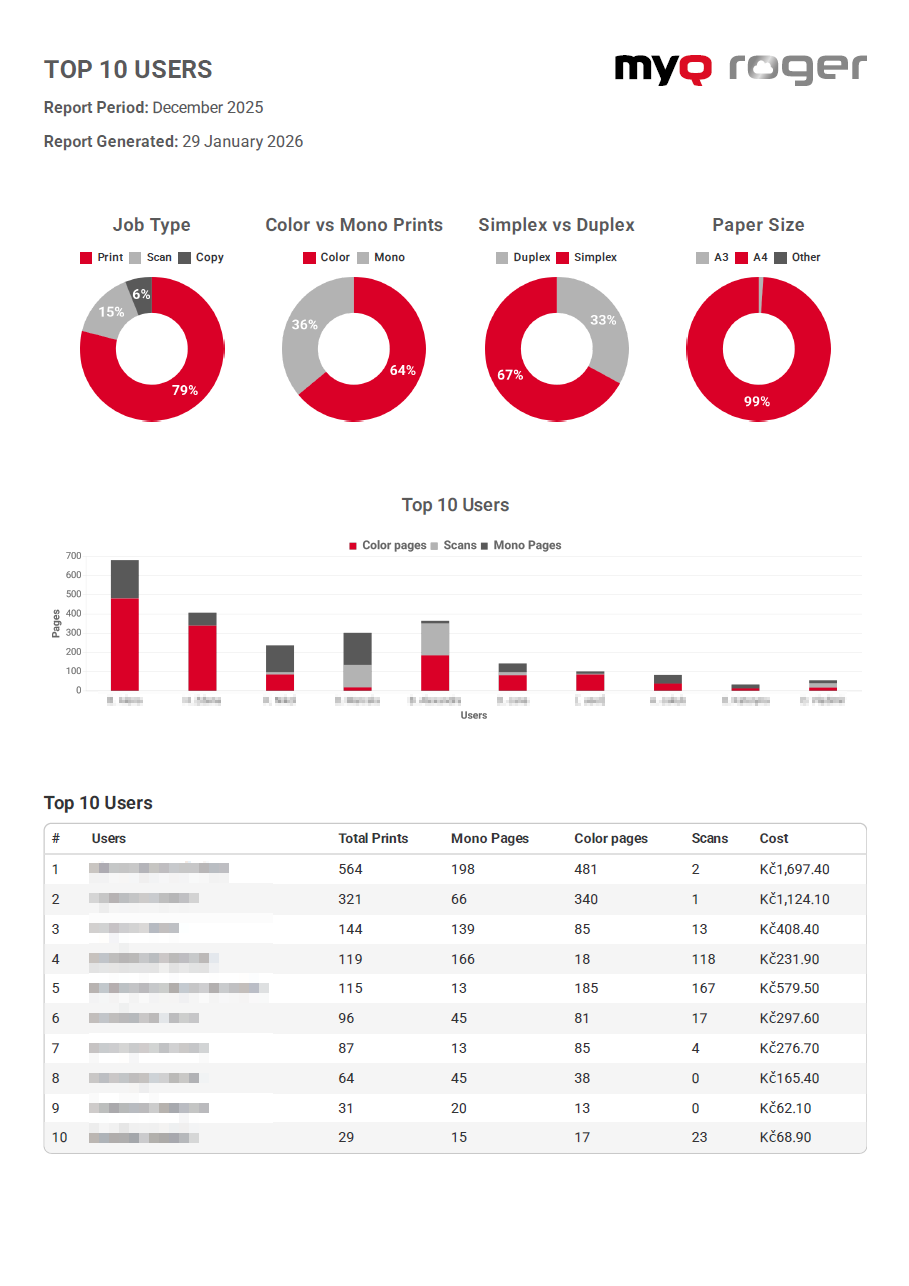
Top 10 Users
Shows your highest-volume users ranked by total output.
|
Column |
Description |
|---|---|
|
User |
Displayed as "Surname Firstname". Anonymized users show |
|
Total Pages |
Mono + Color pages combined |
|
Mono Pages |
Black & white sheets from prints and copies |
|
Color Pages |
Color sheets from prints and copies |
|
Scans |
Total scan sheets |
|
Cost |
Total cost of all jobs. Shows a dash if jobs span multiple currencies. |
Note: PrintSharing users are excluded from this report.
Top 10 Printers
Shows your most-used printers ranked by total output.
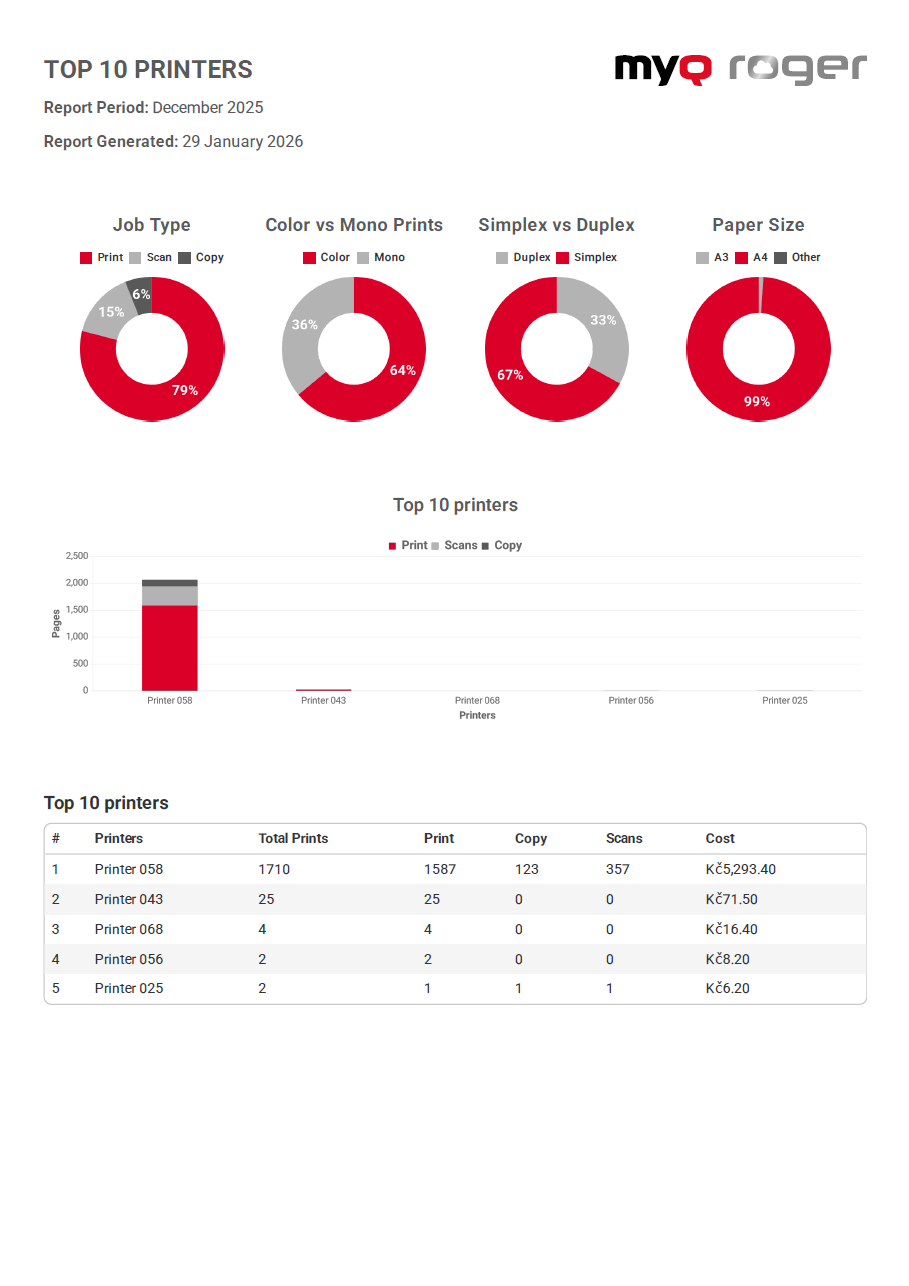
|
Column |
Description |
|---|---|
|
Printer |
The printer's display name |
|
Total Pages |
Print + Copy sheets combined |
|
|
Total print sheets |
|
Copy |
Total copy sheets |
|
Scans |
Total scan sheets |
|
Cost |
Total cost of all jobs. Shows a dash if jobs span multiple currencies. |
Job Overview
Provides insights into job characteristics and paper usage patterns.
|
Metric |
Description |
|---|---|
|
Average Job Size |
Average file size across print, scan, and copy jobs (human-readable format) |
|
Average Job Size (pages) |
Average page count per job |
|
Simplex vs Duplex |
Percentage breakdown of single-sided vs. double-sided jobs |
|
Paper Size |
Percentage breakdown of paper sizes used (A4, Letter, etc.) |