Availability Monitoring
You can view the real-time status of MyQ Roger components in MyQ Roger Status.
You can check live and historical data related to the MyQ Roger system’s performance, see if there is a planned or unplanned outage or scheduled maintenance.
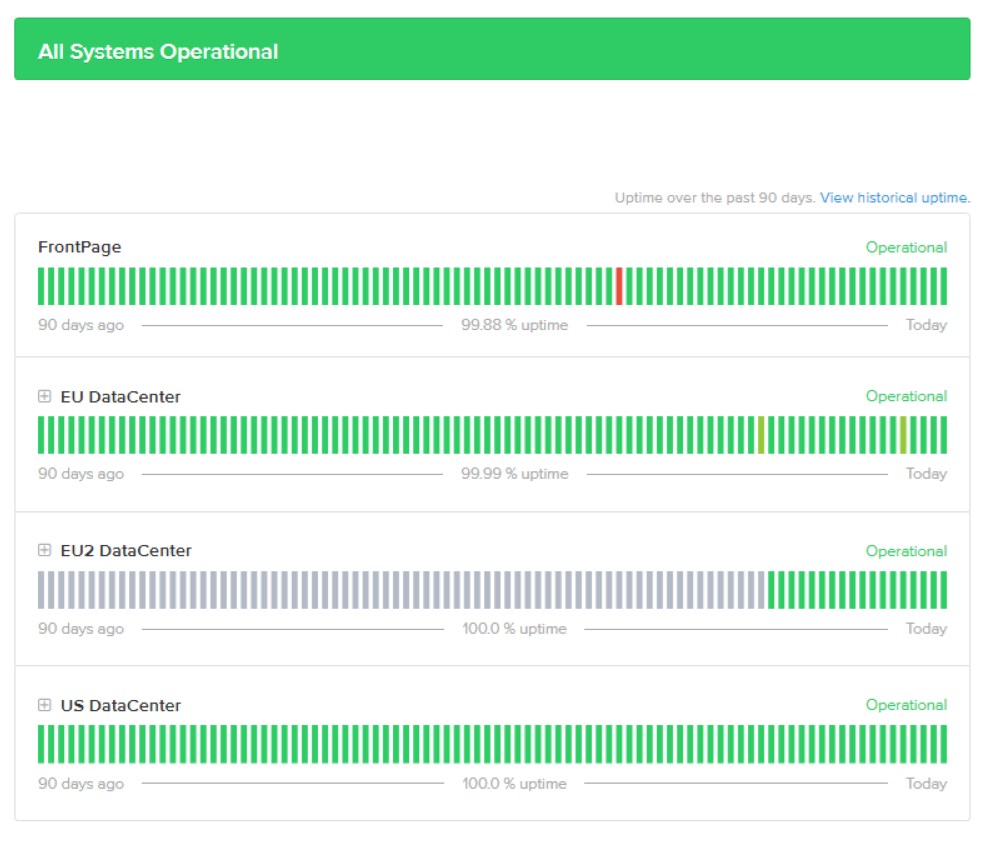
Current Status
There is information about the uptime of each datacenter (EU, EU2, US) and its components in the last 90 days.
You can select your corresponding datacenter and click the plus (+) sign next to its name to expand it and view each component.
If there was downtime, it will be marked in a color other than green (which means that all services are operational). You can click on the different color and see information about the outage.

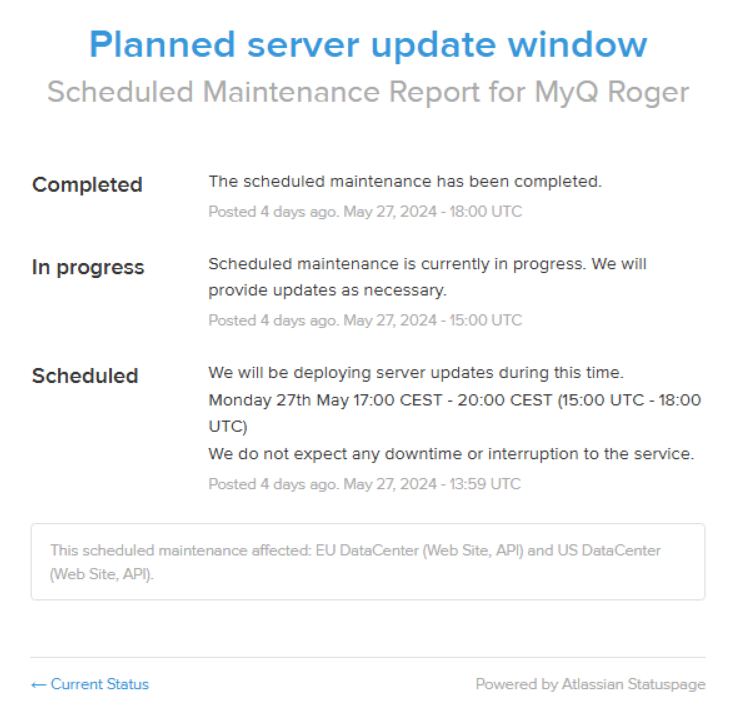
If it was planned, there will be information about the start, progress, and end of the outage.
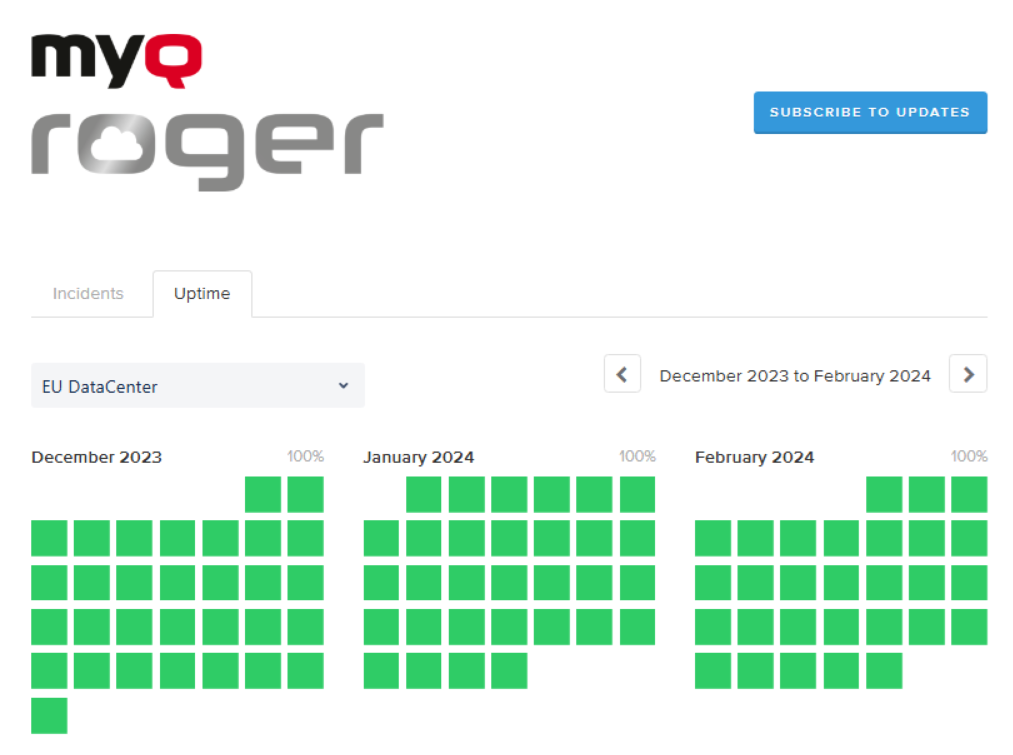
You can also check the uptime’s history by clicking View historical uptime at the top of the table.
Choose the datacenter or datacenter’s component from the drop-down to the left and set the three-month period you want to view on the right.
If there was downtime, it will be marked in a color other than green (which means that all services are operational). You can click on the different color and see information about the outage.
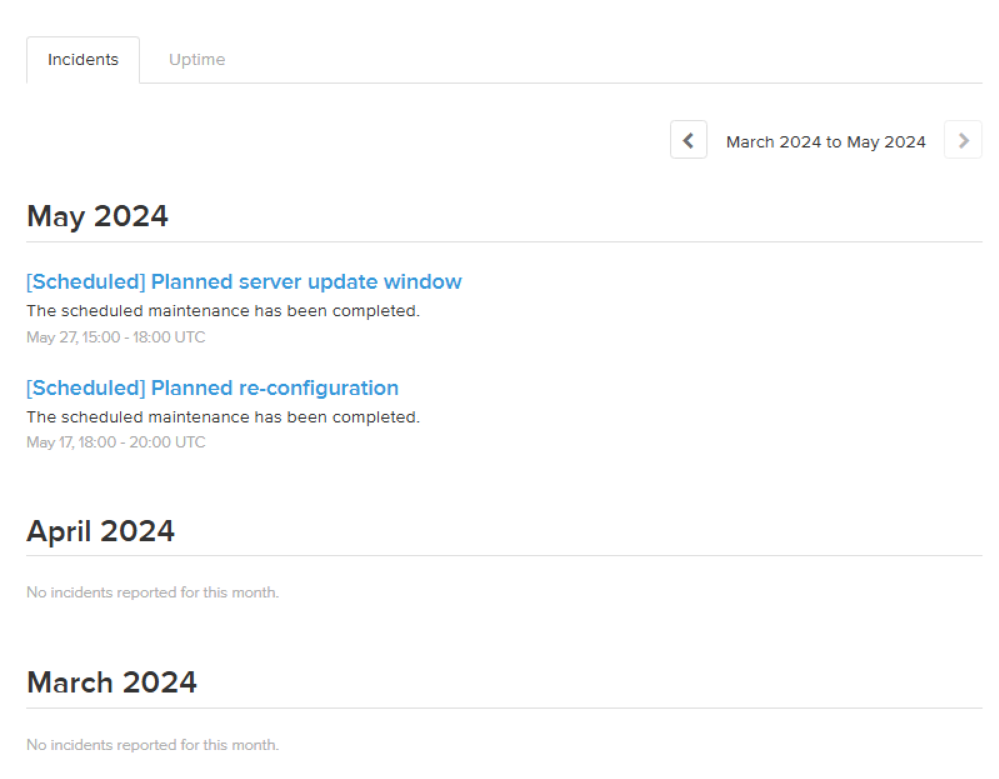
Past Incidents
Below the real-time status tables, there is a daily feed of past incidents. If the date you are looking for is not listed, you can click Incident History at the end of the page. You can now see an overview of past incidents for the last three months. You can change the three-month period on the top-right.
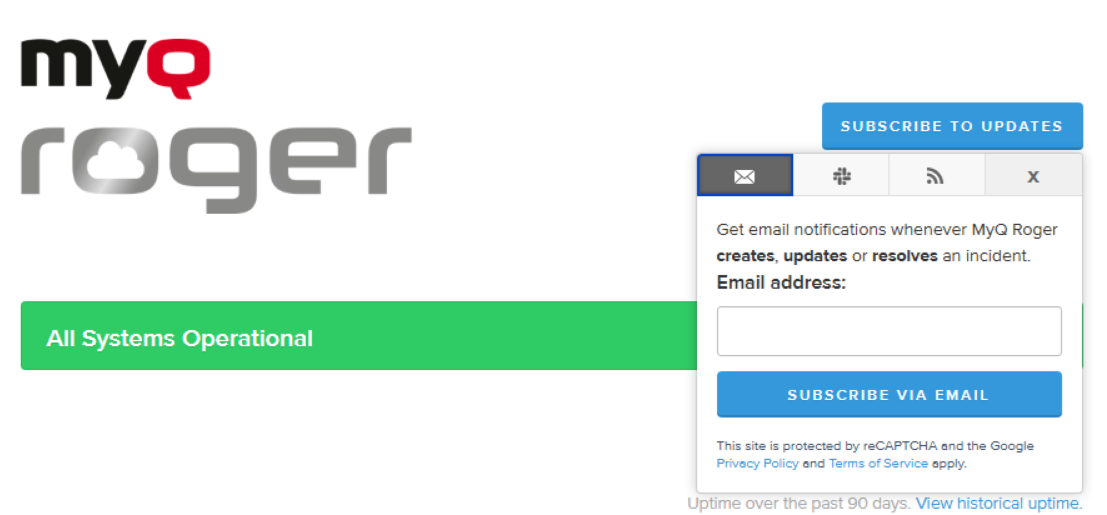
Subscribe to Updates
Click Subscribe to Updates to receive a notification any time there is an update. You can get updates via email, Slack, and Atom Feed or RSS Feed.